
UX Maturity- SAP Signavio
Project Details
Confidentiality: due NDA reason I can't display the final results. This portfolio is about the process that was taken to evaluate the UX maturity in the company.
Company: SAP
My role: UX researcher
Project Date: June 2024
Tools: Microsoft forms, excel, power point
About this project
The company needs to establish a baseline to evaluate our current maturity in delivering an excellent user experience and take steps to enhance our UX capabilities for our customers. To this end, a colleague and I initiated a research project to assess the UX Maturity of SAP Signavio. Through this assessment, we measured our current state and developed recommendations for improvement.
Method
Method: The method chosen was the UX Maturity Model by Nielsen Group.
What is UX maturity?
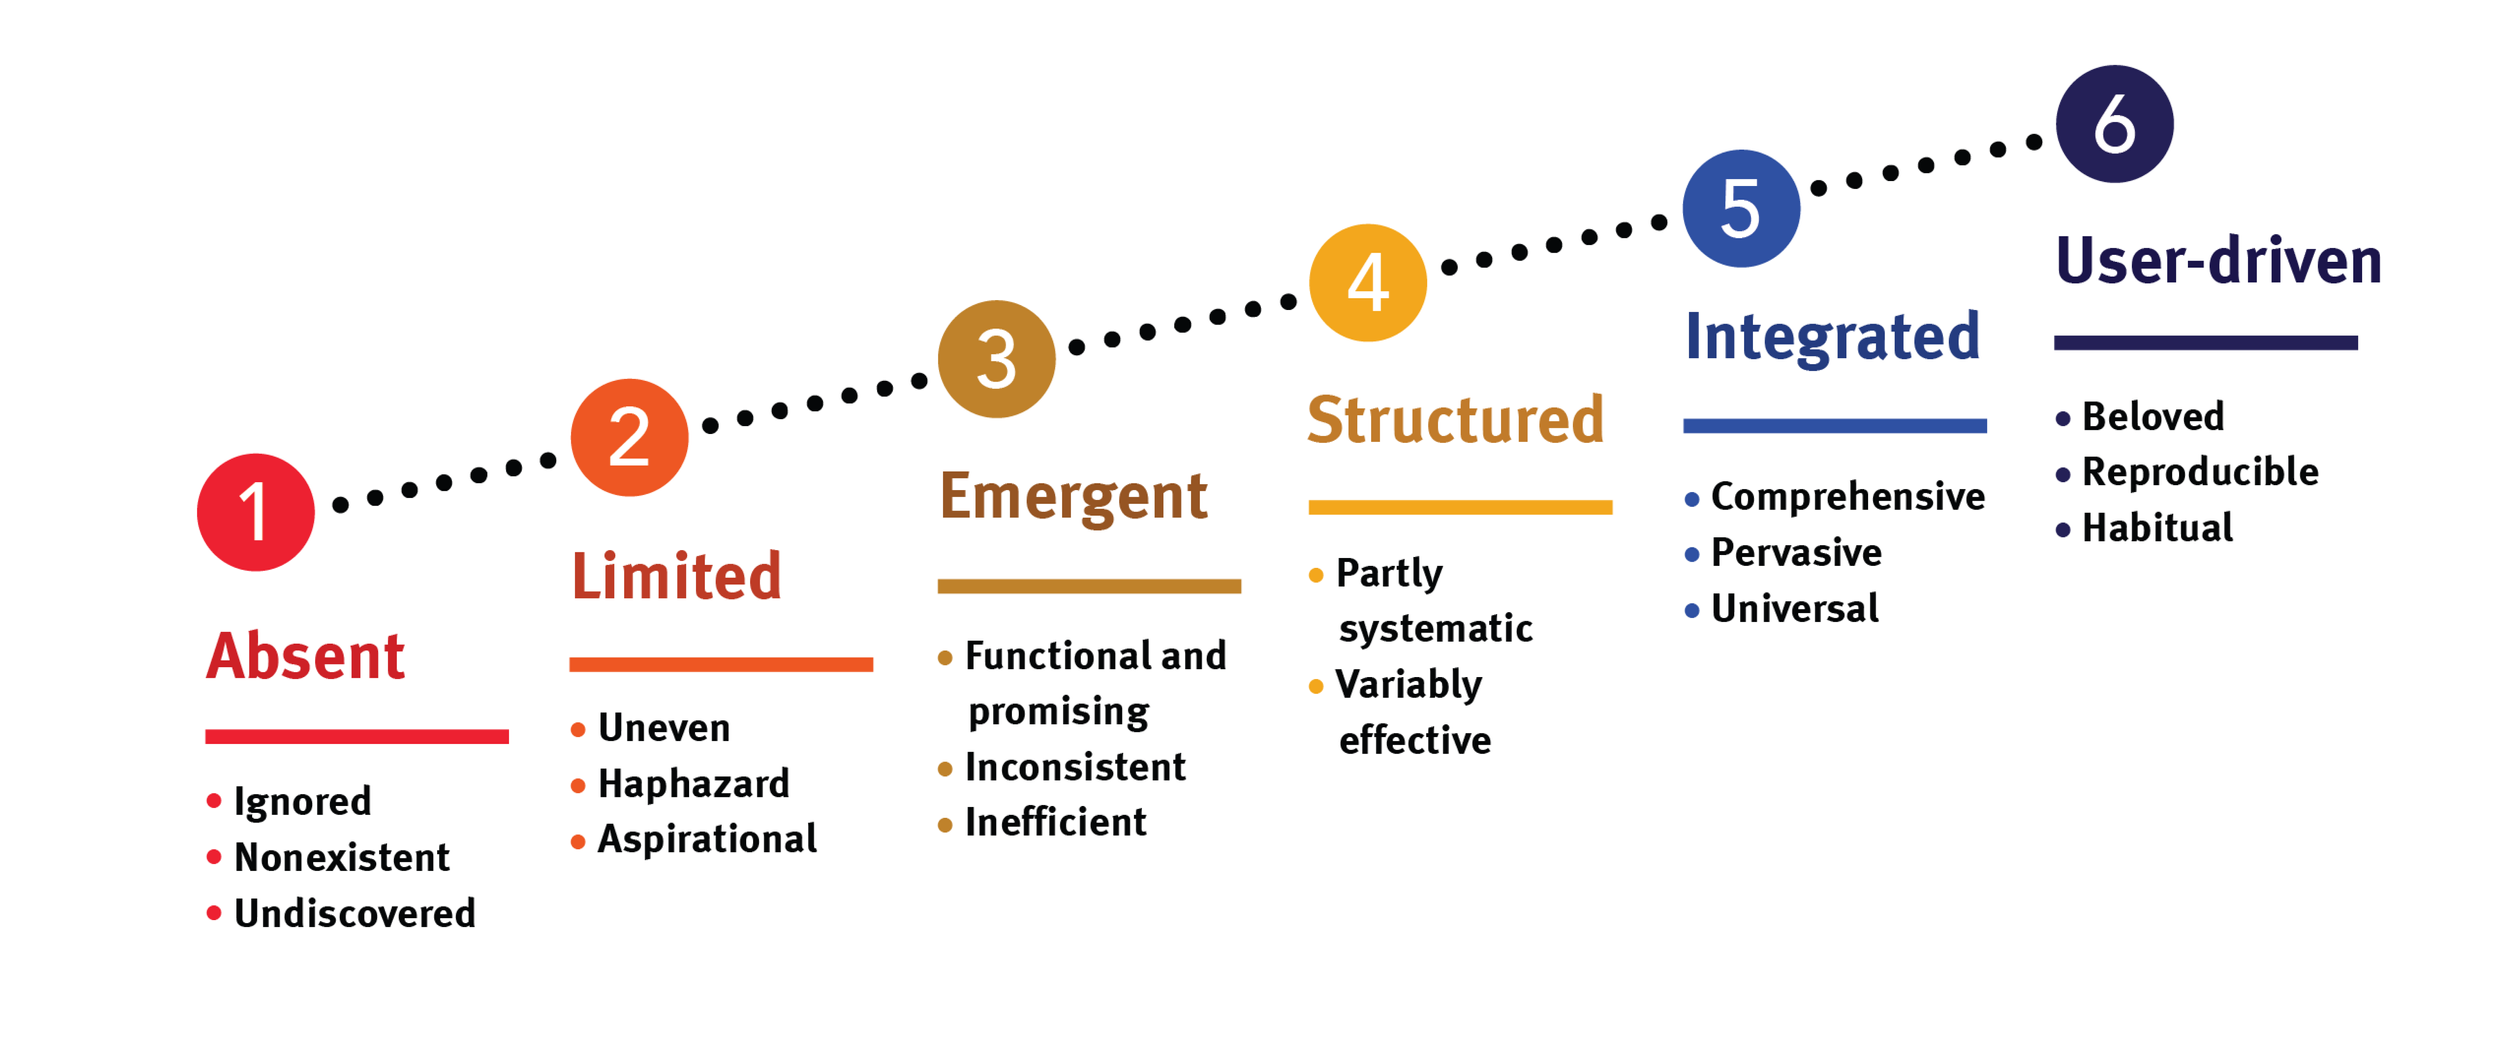
UX maturity assesses an organization's capability by examining the quality and consistency of its research and design processes, resources, tools, operations, and the commitment to UX demonstrated by its leadership, workforce, and culture. This method range the maturity in 6 stages:
Four dimensions UX maturity
-

STRATEGY
Vision, Planning & prioritization and Buget
-

CULTURE
Awareness, Support, Competency and Adaptability
-

PROCESS
Methods, Collaboration and Consistency
-

OUTCOMES
Impact of the Design, and Measurement

The Survey
To assess the maturity we choose to apply a survey. The survey was sent to internals (designers, developers, product managers, marketing and etc). The survey cover the four dimensions that compile UX maturity : Strategy, Culture, Process and Outcomes. Each category has a few questions with the total of 7 possible answers. The example below illustrate it.
Outcomes
How are UX metrics (e.g., usability scores, usefulness scores, task success) used to assess and guide UX design quality within Signavio?
1) Metrics are not used to assess UX quality.
2) A limited number of UX metrics are collected, but they are not systematically used.
3) UX metrics are regularly collected and reviewed, but their impact on decision-making is limited.
4) A comprehensive set of UX metrics is collected, influencing some design decisions.
5) UX metrics are integral to the design process, with clear impacts on design and strategic decisions.
6) UX metrics are used in advanced ways, with data-driven UX strategies shaping organizational priorities and innovation.
7) Don't know / Not applicable
Results
-
1- HOW WE CALCULATE THE RESULTS? Each question was assessed based on the average response, calculated by summing all answers and dividing them by the total number of responses
-
2- Every dimension (Strategy, Culture, Process, Outcome) includes X questions. We calculate the average for each question independently. The average score for a specific dimension is obtained by summing these averages and dividing by the number of questions within that dimension.
-
3- The final score is the average of all dimensions (Strategy, Culture, Process, Outcome)
Action points
Based on the results I wrote recommendations to improve the UX maturity in the company. Here some examples:
To Highlight the importance of applying user experience methods and bring more visibility to the topic I recommended to create success stories, where the designer can showcase across non-experts the positive impact that UX improvements had on customer experience
Execute and promote impactful projects that made a crucial difference in order to make the value of UX becomes evident
Measure the UX in key features and use the data to improve it, the data can be used later to compare the company’s progress
Transparency: Promote the company's UX strategies, plans and processes.